Data Analysis
14 Jan 2025
Diana Gremore
Introducing RealCount’s Heatmap & Summarizer: A New Way to See Your Ticket Sales

At RealCount, we know how important it is to not just track your ticket sales, but to truly understand them. That’s why we’re excited to introduce our Heatmap & Summarizer, two combined tools designed to give you a clearer look at how your events are performing. Whether you book artists, book venues, or market either, these features provide the insights you need to make informed decisions.
## Explore Your Data With the Heatmap
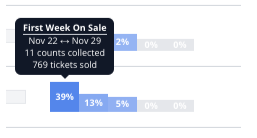
The Heatmap is your go-to tool for a detailed breakdown of your sales cycle. It allows you to search by artist, city, venue, or year to instantly pull up key stats for your relevant events and visualize when sales are happening across the sales cycle.
### What makes the Heatmap so helpful?
- **Search and Filter**: Find the events you want by narrowing down results by artist, venue, city, or year.
- **Year-over-Year & Tour Comparisons**: Identify shifts in performance and sales trends across different years, tours, venues, or cities to better understand what’s working.
- **Visualize Sales Timing**: See when sales are most concentrated, whether it’s the first week, maintenance periods, or the final weeks or days before the event.
- **High-Level Metrics**: Quickly access data like on-sale dates, performance dates, capacity, tickets sold, and percent sold.
 ## Summarize Your Insights With Ease
The Summarizer takes your data to the next level, making it simple to spot trends and performance patterns at a glance.
### What can the Summarizer show you?
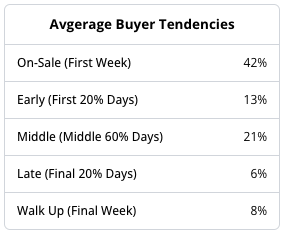
- **Buyer Tendencies**: Understand when your audience is buying tickets—whether it’s the first week, early cycle, mid-cycle, or last week.
- **Venue Type Breakdown**: Compare how different venue types perform across your events.
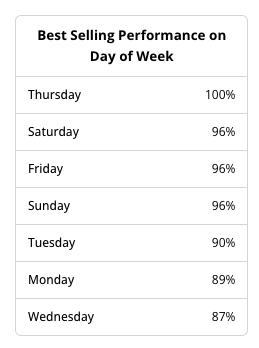
- **Performance Weekdays**: See which days of the week are the most successful for your events by comparing average percentage sold.
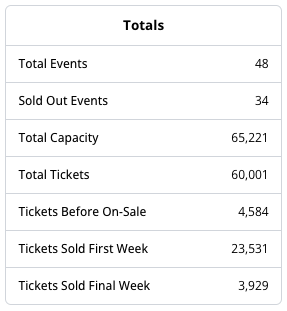
- **Sales Metrics**: Analyze ticket sales and averages across:
- Tickets sold before on-sale dates
- Tickets sold in the first week
- Tickets sold in the final week
- **Ticket Platform Breakdown**: Identify which platforms are driving sales and where there’s room for improvement.
## Summarize Your Insights With Ease
The Summarizer takes your data to the next level, making it simple to spot trends and performance patterns at a glance.
### What can the Summarizer show you?
- **Buyer Tendencies**: Understand when your audience is buying tickets—whether it’s the first week, early cycle, mid-cycle, or last week.
- **Venue Type Breakdown**: Compare how different venue types perform across your events.
- **Performance Weekdays**: See which days of the week are the most successful for your events by comparing average percentage sold.
- **Sales Metrics**: Analyze ticket sales and averages across:
- Tickets sold before on-sale dates
- Tickets sold in the first week
- Tickets sold in the final week
- **Ticket Platform Breakdown**: Identify which platforms are driving sales and where there’s room for improvement.

## From Weeks to Seconds: Insights on the Fly
The data you used to spend weeks compiling and the insights you used to spend hours putting together are now available at the press of a button. Whether you’re looking at year-over-year trends, artist-by-artist comparisons, or city-specific performance, the Heatmap and Summarizer make analysis fast and easy. Export the report and send it to your colleagues, or share your screen on the fly when the conversation strikes. It’s THAT easy.
## More Than Just the Heatmap
The Heatmap and Summarizer are the latest tools in our ever-expanding analytics suite. These tools help you track and understand how your sales and performance trends are shifting, giving you the ability to explore the bigger picture while still drilling down into specific details when you need them.
And we’re just getting started. With an exciting year ahead, we’re preparing to roll out even more features to help you measure success and grow your events.
If you measure success in tickets sold, join RealCount and get ready for the ride. Let’s make 2025 the year you stop working for your data, and make it work for you!
**Sign up today and see what RealCount can do for you.**
© 2025 RealCount Inc.
Privacy Policy
Terms of Service
Contact Us
info@realcount.pro
Stay Connected
Subscribe to our newsletter to receive product updates & monthly tips.